
Self-contained pages that make an idea visible.
Small interactive things I build to understand something and share it — each one a single self-contained page, no accounts, no tracking beyond a page count. Several grew out of an afternoon poking at the IANA time-zone database; one is a tribute to a date; one traces four mystery towers through a county’s deed records.
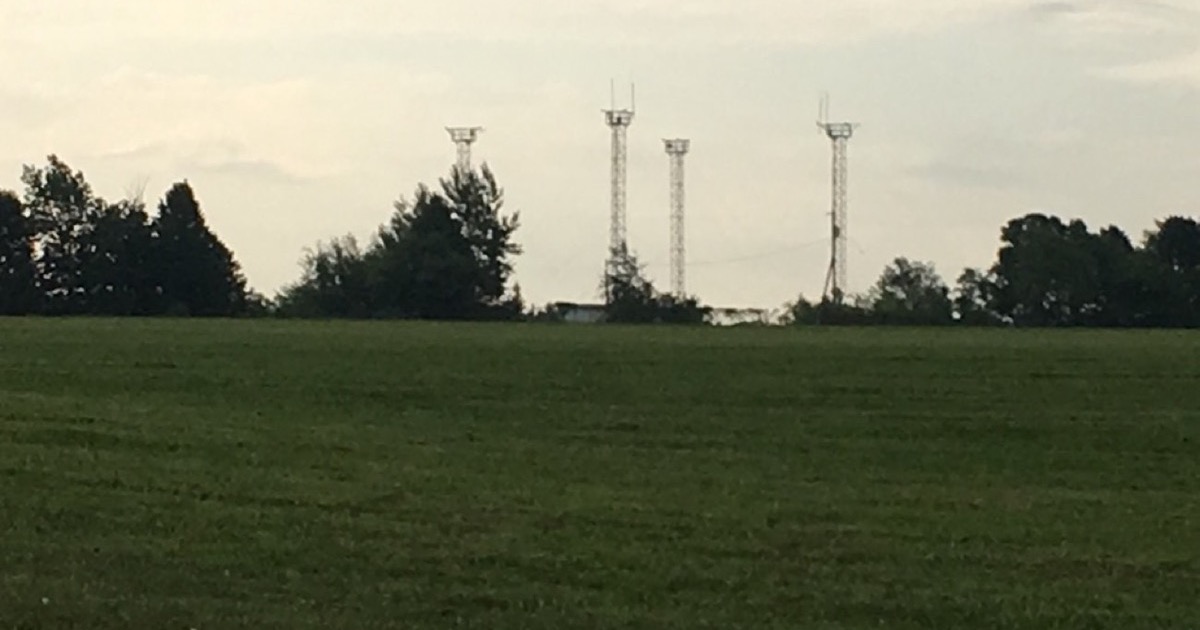
Field investigation · Wausau, WI
Four Cold-War-era towers stood in a farm field for sixty years. A deed-by-deed investigation into what they really were — and whose field it was.
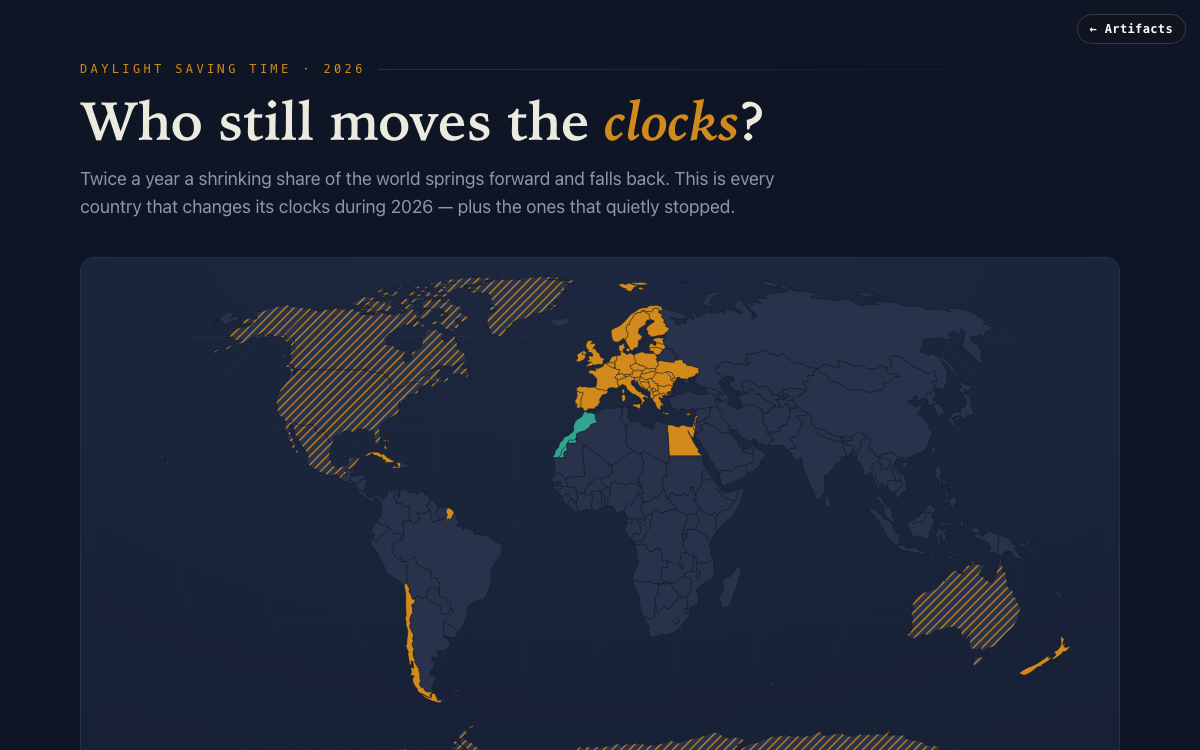
Interactive map · 2026
A world map of every country that moves its clocks in 2026 — who observes daylight saving, who only partially does, and the growing majority who don’t.
Interactive chart · any location
Enter any city — or use your own — and watch every daylight-saving jump, war-time plateau, and zone realignment your clock has lived through, computed live in your browser from the IANA time-zone database.
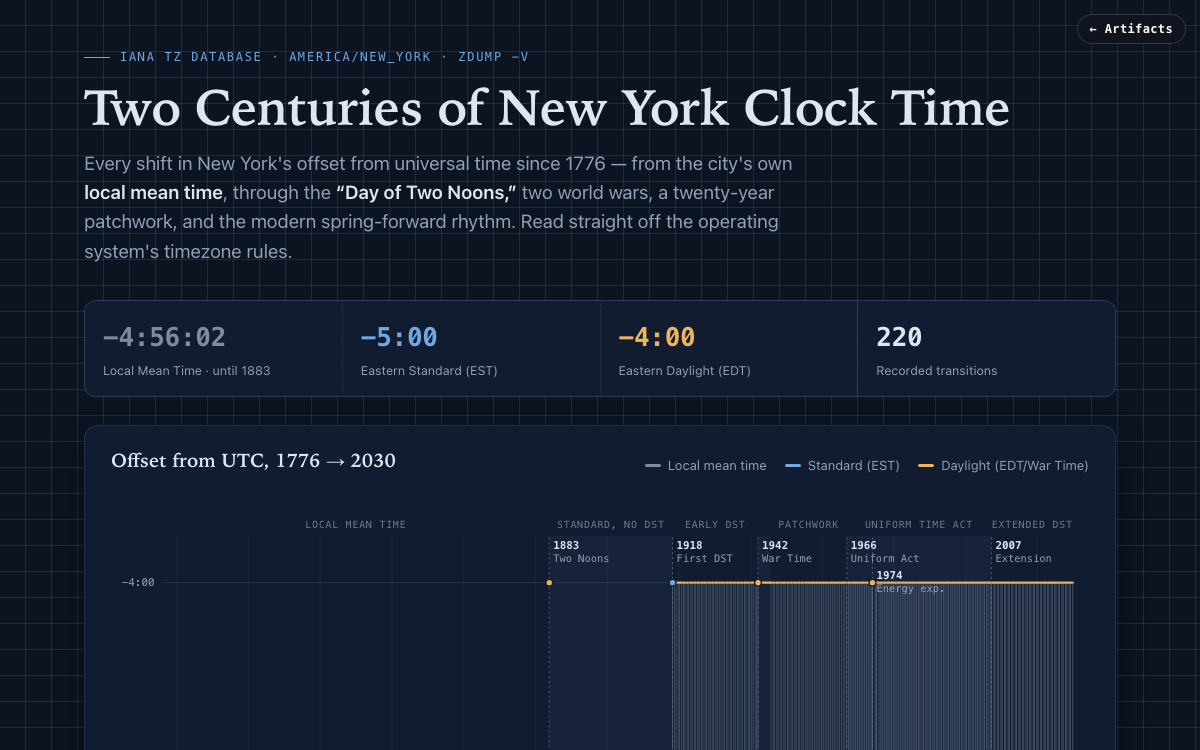
Interactive chart · IANA tz data
Every shift in New York’s offset from UTC since 1776 — local mean time, the Day of Two Noons, two world wars, and the modern spring-forward rhythm.
Interactive chart · IANA tz data
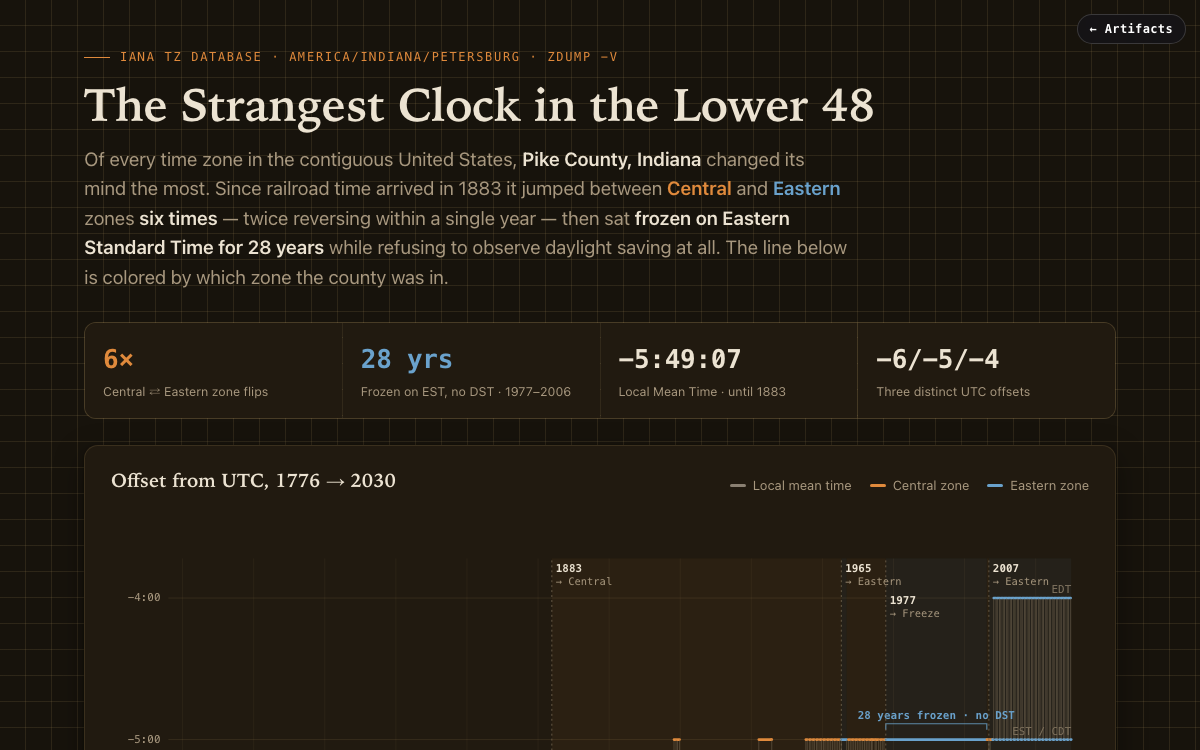
Pike County, Indiana flipped between Central and Eastern six times and froze on Eastern Standard Time for 28 years. The contiguous-US zone that changed its mind most.

Animated tribute · July 4, 2026
An animated tribute to the 250th anniversary of American independence — fireworks over Independence Hall and a scrollable timeline of the American experiment.